
Grafana Loki is a log aggregation system inspired by Prometheus, it provides a panel for indexing and visualizing system logs. It is designed to be very cost-effective and easy to operate. It does not index the content of the logs but rather a set of labels for each log stream.
Grafana Loki uses a log collector called Promtail which sends log labels for indexing.
In this article, I will discuss how to install and use Grafana Loki in a Ubuntu system.
Prerequisites
To follow this article you should have the following –
- A system running Ubuntu Linux
- Access to a user account with sudo priviledges
How to install Grafana Loki in Ubuntu
The installation of Grafana Loki consists of various steps, follow each step to install the required packages on your system.
Installing Grafana monitoring tool
Before you install any package on your system make sure that the apt package repository is updated –
sudo apt updateNext, use the given command to install some requisite packages –
sudo apt install -y gnupg2 curlUse the following command to add the Grafana GPG key to your system –
curl https://packages.grafana.com/gpg.key | sudo apt-key add -Run the given command to add Grafana package repository to your system –
sudo add-apt-repository "deb https://packages.grafana.com/oss/deb stable main"Refresh the apt repository by using –
sudo apt updateFinally, use the given command to install Grafana on your system –
sudo apt -y install grafanaOnce the package is installed, use the following command to start and enable Grafana services –
sudo systemctl start grafana-serversudo systemctl enable grafana-serverAdjust firewall and allow port number 3000 –
sudo ufw allow proto tcp from any to any port 3000Now you can access Grafana in your browser by using –
http://server_IP_add:3000For example –
http://localhost:3000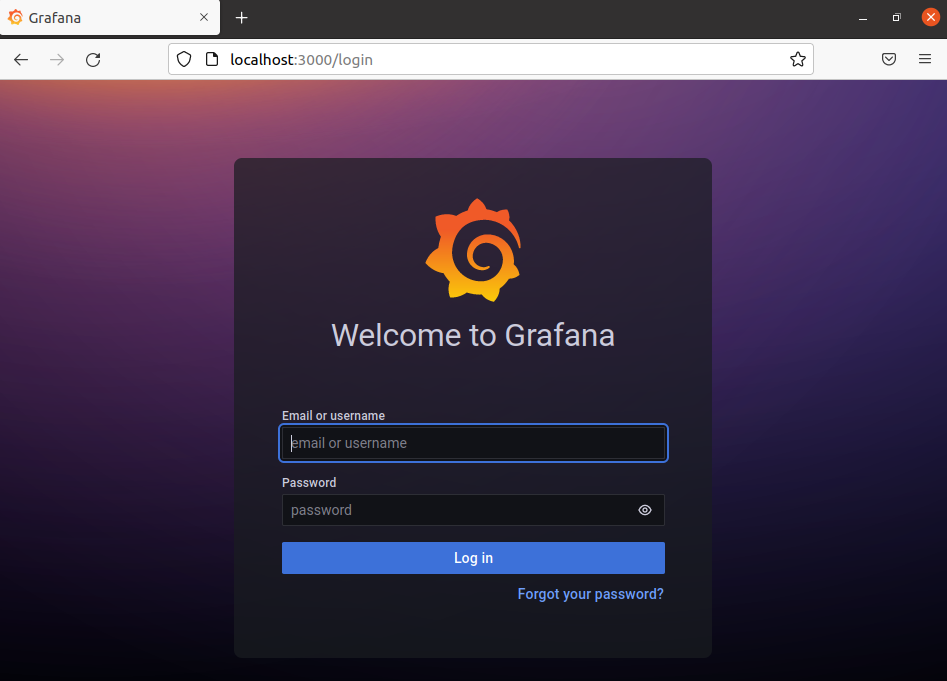
Installing Grafana Loki
Go to the release page of Loki and download the latest Grafana Loki binaries for Ubuntu –
wget https://github.com/grafana/loki/releases/download/v2.4.2/loki-linux-amd64.zip Install the unzip tool if it is not already installed on your system –
sudo apt install -y unzipExtract the downloaded package to /usr/local/bin directory-
unzip loki-linux-amd64.zipsudo mv loki-linux-amd64 /usr/local/bin/lokiCreate config directory by using –
sudo mkdir /etc/lokisudo mkdir -p /data/lokiNext, edit the configuration file –
sudo nano /etc/loki-local-config.yamlAdd the following content in this empty file –
auth_enabled: false

server:
  http_listen_port: 3100

ingester:
  lifecycler:
    address: 127.0.0.1
    ring:
      kvstore:
        store: inmemory
      replication_factor: 1
    final_sleep: 0s
  chunk_idle_period: 5m
  chunk_retain_period: 30s
  max_transfer_retries: 0

schema_config:
  configs:
    - from: 2018-04-15
      store: boltdb
      object_store: filesystem
      schema: v11
      index:
        prefix: index_
        period: 168h

storage_config:
  boltdb:
    directory: /data/loki/index

  filesystem:
    directory: /data/loki/chunks

limits_config:
  enforce_metric_name: false
  reject_old_samples: true
  reject_old_samples_max_age: 168h

chunk_store_config:
  max_look_back_period: 0s

table_manager:
  retention_deletes_enabled: false
  retention_period: 0s
Now create Loki systems services under the directory /etc/systemd/system –
sudo tee /etc/systemd/system/loki.service<<EOF
[Unit]
Description=Loki service
After=network.target

[Service]
Type=simple
User=root
ExecStart=/usr/local/bin/loki -config.file /etc/loki-local-config.yaml

[Install]
WantedBy=multi-user.target
EOF
Now reload system daemon and start Loki services –
sudo systemctl daemon-reloadsudo systemctl start lokiYou can check if Loki services are running or not –
sudo systemctl status loki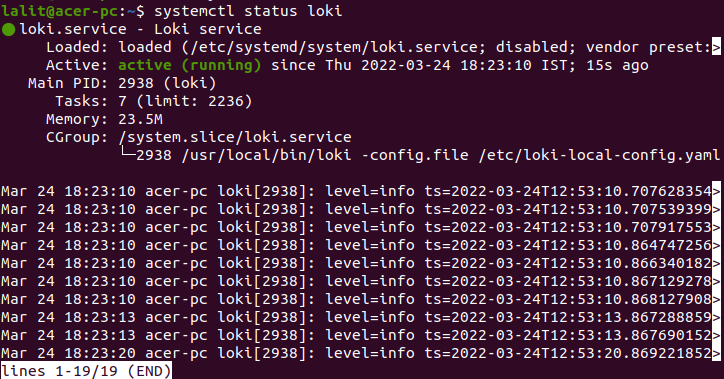
You can get Loki metrics by entering the given URL –
http://server_IP_add:3100For example –
http://localhost:3100Installing Promtail agent
Pomtail is an agent which ships the contents of local logs to a private Grafana Loki instance or Grafana cloud and it is usually deployed to every machine that has applications needed to be monitored.
Go to its release page on GitHub and download Promtail binary zip file –
curl -LO https://github.com/grafana/loki/releases/download/v2.4.2/promtail-linux-amd64.zipOnce the package is downloaded extract the package to /usr/local/bin –
unzip promtail-linux-amd64.zipsudo mv promtail-linux-amd64 /usr/local/bin/promtailNow create a YAML configuration file for Promtail in the /usr/local/bin directory –
sudo nano /etc/promtail-local-config.yamlAdd the given lines to this file –
server:
  http_listen_port: 9080
  grpc_listen_port: 0

positions:
  filename: /data/loki/positions.yaml

clients:
  - url: http://localhost:3100/loki/api/v1/push

scrape_configs:
- job_name: system
  static_configs:
  - targets:
      - localhost
    labels:
      job: varlogs
      __path__: /var/log/*log
Next create a service file for Promtail –
sudo tee /etc/systemd/system/promtail.service<<EOF
[Unit]
Description=Promtail service
After=network.target

[Service]
Type=simple
User=root
ExecStart=/usr/local/bin/promtail -config.file /etc/promtail-local-config.yaml

[Install]
WantedBy=multi-user.target
EOF
Reload system daemon –
sudo systemctl daemon-reloadAnd start Promtail services –
sudo systemctl start promtail.serviceYou can also check the promtail service status by using –
systemctl status promtail.service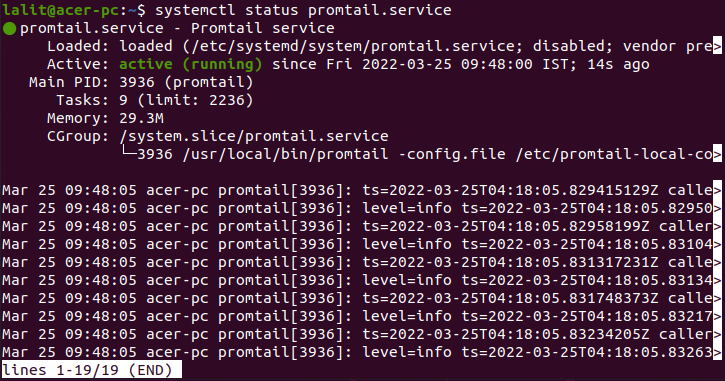
Configuring Loki data source
You have setup everything now it time to link loki to Grafana monitoring tool. Use the given URL to open Grafana login page –
http://localhost:3000Use username and password as admin.
Once logged in successfully you will be able to see the Grafana dashboard.
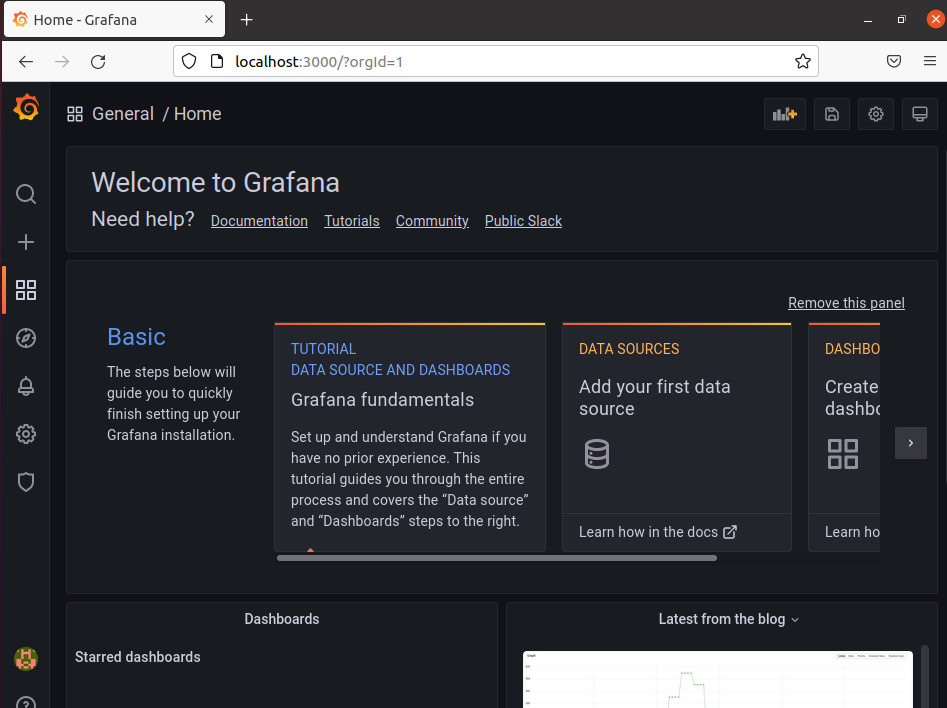
Go to Configuration> Data sources> Add Data Source now find and click on Loki.
Add the following settings to this page –
Name – Loki
URL – http://localhost:3100
As you can see in the image below.
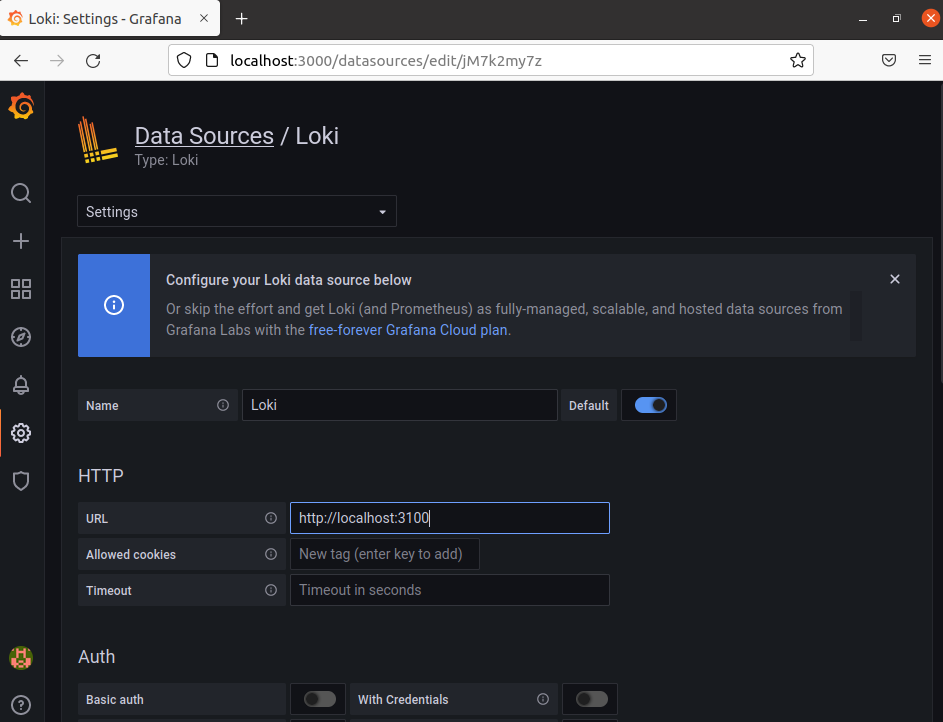
Scroll down and click on Save & test.
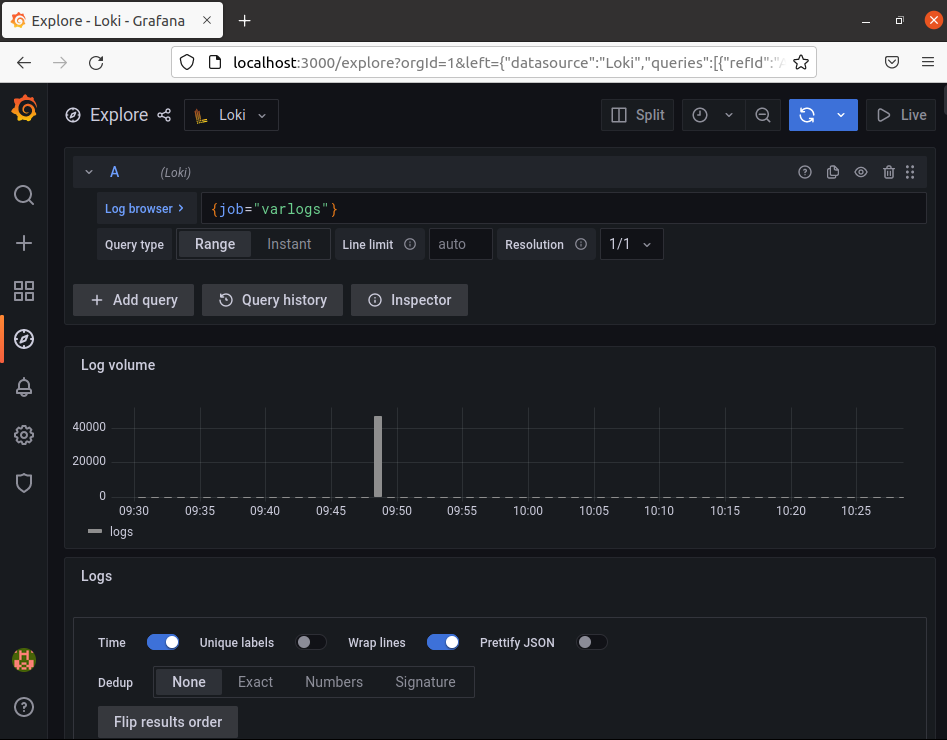
Visualizing logs in Grafana Loki
To visualize logs in Grafana Loki go to Exaplore and then select Loki at the data source. In the log browser enter a Loki query for example to view varlogs enter {job=”varlogs”}.
Now you can scroll and view logs displayed in the dashboard.
Conclusion
I hope you have setup Grafana Loki successfully on your Ubuntu system. Now if you have a query then write us in the comments below.
I appreciate your creativity and the effort you put into every post. Keep up the great work!
i had this Unable to connect with Loki. Please check the server logs for more details.